- Introduction
- Visualizing Statewide Data
- Visualizing Site Data
- Visualizing Direction Data
- Visualizing Lane Data
- Downloading Data
- Disclaimer
Introduction
The Bureau of Transportation Data and Safety (BTDS), Traffic and Technology Section, is responsible for administering the New Jersey Departments of Transportation’s (NJDOT) Traffic Monitoring Program. This program mustbe in compliance with Federal regulations and guidelines. and includes the collection, processing, summarization, and reporting of traffic count data along New Jersey’s roadways. Weigh-in-Motion (WIM) continuous data collection is an important part of the program. The WIM sites collect various types of traffic data such as volume, classification, speed, and weight using in-road sensors. The purpose of this website is to present WIM data in a user friendly manner.The website is organized in the following way:
a) Main Landing Page
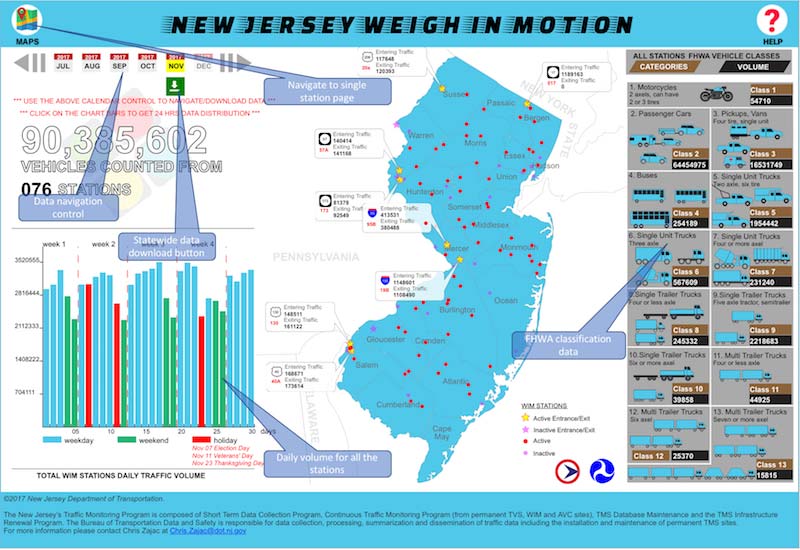
This page summarizes the traffic data collected from all active WIM sites in New Jersey. It categorizes records into two groups: The Federal Highway Administration (FHWA) classification (13 vehicle class scheme) category and the overall traffic volume. While the FHWA classification relates to the traffic volume by vehicle type (i.e. motorcycles, buses, trucks, etc.), the volume count illustrates the traffic volume information regardless of vehicle type.
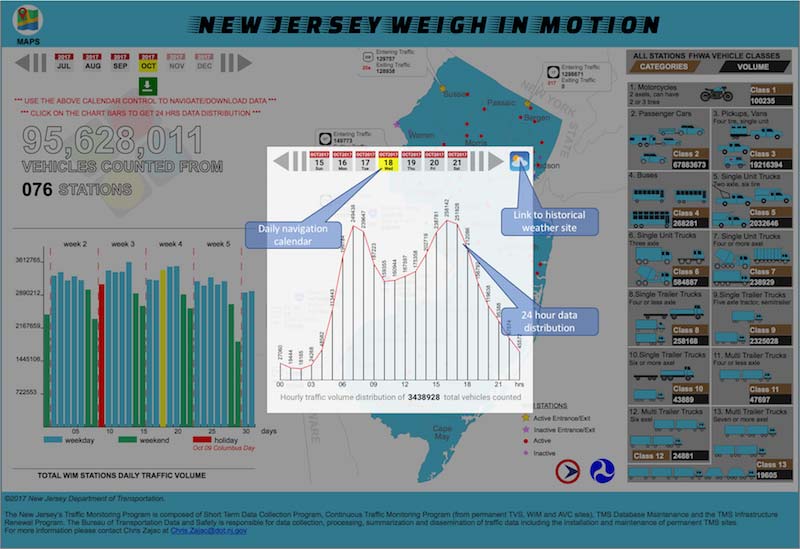
On the right side of the page, the FHWA vehicle class count information is shown. The state map in the middle of the page visualizes the spatial distribution of WIM stations, as well as the traffic volume of vehicles entering and exiting New Jersey. On the left side of the page, a bar chart represents the overall traffic volume (all vehicle types included) collected in New Jersey during the selected month. Clicking on any bar will display the daily (24 hours) overall traffic volume distribution.
b) Single Site Page
This page displays traffic data as it relates to an individual WIM stite. For each WIM site (see map here), users are able to see not only the traffic information of the site as a whole but also dissect this information for each travel direction or by lane for the selected site. Similarly to the landing page, this page allows users to visualize FHWA classification and traffic volume count data for each direction and lane of the site.
Visualizing Statewide Data
Statewide traffic information is presented on the landing page. Users can navigate through the data using the calendar control located on top of the page. This calendar displays all of the months with available data.
Clicking on any month will display the data related to that month. The image below illustrates each component on the landing page.
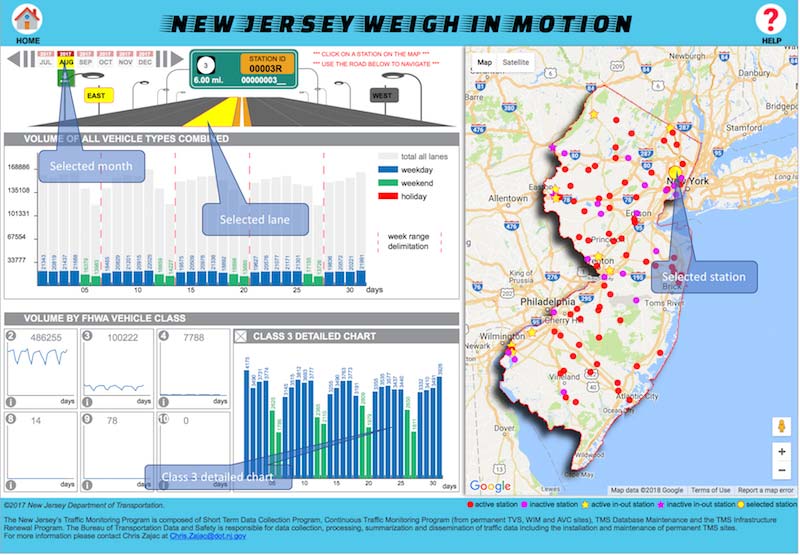
Visualizing Single Site Data
As described in the introductory section, the single station page allows users to query data related to a particular site. A site is defined as a location that includes traffic count/weight sensors recording vehicles passing through its location. A single site can record traffic data in both travel directions or in a single direction. Each travel direction is composed of one or more travel lanes. The information presented on this page can be queried as follows:- click on a site on the google map to display traffic data related to all of the station directions,
- click on a direction sign to display traffic data related to that direction,
- click on a lane to display the traffic data information related to that lane.

Visualizing Travel Direction Data
To visualize traffic data in a particular direction, simply click on the direction's sign on the road navigation control. For traffic data information about a specific FHWA class, simply click on the information icon located below the classification chart.

Visualizing Travel Lane Data
To visualize traffic data per lane, simply click on the lane on the road navigation control. For traffic data information about a specific FHWA class, simply click on the information icon located below the classification chart.
Downloading WIM Data
WIM data can be downloaded locally. This can be accomplished by navigating the landing page or the single site page by clicking on the green download symbol (see image below).

Disclaimer
The NJDOT provides the WIM data on this website as a public service. The WIM data shown on this website is collected from roadway sensors. While reasonable efforts have been made to ensure the quality of the WIM data through routine maintenance and calibration, the information provided on this website should be treated "as is". The NJDOT is not responsible for any misinterpretation or alteration of the data.
Privacy Notice | Legal Statement
For more information please contact us at DOT-BTDS.WeighInMotion@dot.nj.gov
Copyright © State of New Jersey, 2002-2017
Department of Transportation
P.O. Box 600
Trenton, NJ 08625-0600